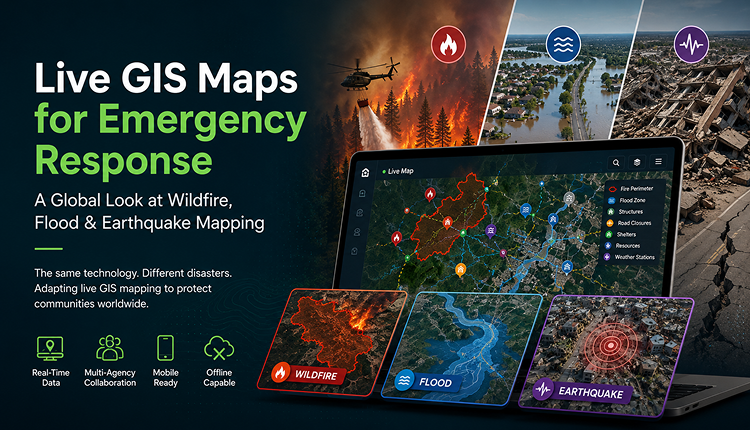
Live GIS Maps for Emergency Response: A Global Look at Wildfire, Flood & Earthquake Mapping
How the Same Technology Adapts to Wildfires, Floods, and Earthquakes Across the World
A flood response team in Jakarta and a wildfire crew in California are solving completely different problems, but they're reaching for the same category of tool. Live GIS maps for emergency response have become the common thread across hazard types and continents, not because one map fits every disaster, but because the underlying need is identical everywhere: know what's happening right now, not what was true an hour ago.
What changes from region to region, and hazard to hazard, is which data layers matter most. A flood-prone coastal city cares about river gauge levels and tide data. A wildfire-prone region cares about wind direction and fuel moisture. An earthquake zone cares about aftershock patterns and structural damage reports. The platform is often similar; what gets plotted on it is not.
Live GIS maps for emergency response are real-time geographic information systems that track hazards, resources, and personnel during a crisis. Agencies worldwide adapt the same core technology to different disaster types, layering wildfire perimeter and wind data in fire-prone regions, river and tide data for flood monitoring, and aftershock and structural data for earthquake response, giving responders a shared, current view no matter the hazard.
Why the Same Technology Handles Very Different Disasters
At its core, a live GIS map does three things: it shows a base layer of the affected area, it pulls in real-time data feeds, and it lets multiple agencies view and update that data together. That framework doesn't change whether the hazard is fire, water, or ground movement. What changes is the data plugged into it.
This is why "emergency GIS software" isn't really one product category it's a flexible system that gets configured around whichever hazard a region faces most. A coastal city in the Philippines and a fire district in Australia might use the same underlying mapping platform, configured completely differently.
Live GIS Mapping for Wildfires
Wildfire response depends on tracking a boundary that moves, sometimes fast enough to outrun a printed map within the hour. Live GIS maps used for wildfire response typically layer:
- Real-time fire perimeter data, often from satellite or aerial thermal imaging
- Wind speed and direction, since fire spread follows wind more than almost any other factor
- Fuel moisture and vegetation density, which affect how fast a fire can move through an area
- GPS locations of fire crews and engines relative to the active perimeter
Regions like the western United States, southern Australia, and parts of the Mediterranean rely heavily on this configuration, where fire season planning and live tracking both depend on the same GIS infrastructure.
Live GIS Mapping for Floods
Flood response runs on a different clock. Rather than tracking a fast-moving edge, flood GIS mapping tracks rising and falling levels over hours or days, layering:
- Live river and tide gauge data
- Rainfall accumulation from weather feeds
- Road and bridge closure reports as water levels change
- Population density in low-lying zones, to prioritise evacuation resources
Coastal and monsoon-affected regions parts of India, Indonesia, the Philippines, and the UK's flood-prone river basins depend on this kind of live layering, since flood extent often shifts by the hour as rainfall and tides interact.
Live GIS Mapping for Earthquakes
Earthquakes don't give the warning that wildfires and floods sometimes do, so GIS mapping here shifts from prediction to rapid post-event coordination:
- Structural damage reports submitted by field teams and residents
- Aftershock tracking and magnitude data
- Utility outage mapping (gas, power, water) layered against population centres
- Search-and-rescue grid assignments, updated as teams clear buildings
Japan, New Zealand, and parts of the western United States have built some of the most mature earthquake GIS systems, largely because rapid post-event data layering is what determines how fast search-and-rescue teams reach the highest-priority sites.
How Regions Approach Emergency GIS Differently
Beyond the hazard type, regional infrastructure shapes how live GIS mapping gets used. Areas with strong cellular and satellite coverage lean on continuous live feeds. Regions where infrastructure itself is vulnerable during a disaster a common challenge across parts of South Africa, Brazil, and Southeast Asia tend to prioritise offline-capable GIS tools that can sync data the moment connectivity returns, rather than assuming a constant connection.
Government-led systems are also more centralised in some regions (parts of the EU and Singapore, for example, where national agencies often run unified platforms) versus more fragmented, agency-by-agency systems in others, where interoperability between fire, police, and EMS mapping tools becomes its own challenge to solve.
Step-by-Step: Setting Up Hazard-Specific GIS Layers
- Identify the region's primary hazard profile. Wildfire, flood, earthquake, or a combination.
- Select the relevant live data feeds. Weather APIs, river gauges, seismic monitors, or thermal imaging, depending on the hazard.
- Layer infrastructure data. Hospitals, shelters, utility lines, and evacuation routes relevant to that hazard.
- Build role-based access. Field crews, dispatchers, and command staff often need different views of the same map.
- Test offline functionality in regions where connectivity may fail during the exact events the map is meant to support.
- Run the system during non-emergency periods planned drills, seasonal readiness checks — so it's proven before it's needed.
Key Features to Prioritise by Hazard Type
- Wildfire regions: live perimeter tracking, wind data integration, crew GPS tracking
- Flood regions: river/tide gauge feeds, rainfall accumulation layers, road closure updates
- Earthquake regions: rapid damage-report intake, aftershock tracking, utility outage mapping
- All regions: offline capability, multi-agency access, mobile compatibility, historical logging for after-action review
Real-World Examples
A fire authority in a wildfire-prone region layered live wind data directly onto its GIS platform alongside the fire's tracked perimeter, letting commanders anticipate which crews would be in the fire's path if wind shifted — rather than reacting only after the shift had already happened.
A flood-prone municipality with a seasonal monsoon pattern connected river gauge data directly into its live map, giving both response teams and residents a real-time view of which roads remained passable as water levels changed hour to hour, instead of relying on a static evacuation map printed before the season started.
Comparison Table: GIS Priorities by Disaster Type
| Disaster Type | Primary Data Layers | Update Frequency Needed | Key Challenge |
|---|---|---|---|
| Wildfire | Fire perimeter, wind, fuel moisture | Minutes | Fast-moving boundary |
| Flood | River/tide gauges, rainfall, road status | Hourly | Gradual but shifting extent |
| Earthquake | Damage reports, aftershocks, utility outages | Continuous post-event | No warning |
Best Practices
- Configure GIS layers around the region's actual hazard profile instead of using a generic default setup
- Build offline resilience into regions where the hazard itself threatens connectivity
- Standardize data-sharing formats across agencies before an emergency, not during one
- Run the system through regular drills so field teams trust it under pressure
Common Mistakes to Avoid
- Using the same generic data layers everywhere instead of tailoring them to wildfire, flood, or earthquake response
- Assuming constant connectivity in regions where infrastructure is part of what the disaster damages
- Failing to coordinate data formats across fire, police, EMS, and utility teams
- Treating global deployments as one-size-fits-all instead of adapting to local hazard and infrastructure realities
Expert Tips
Agencies operating across multiple hazard types in a region that sees both flooding and earthquakes, for instance, get the most value from GIS platforms that let them toggle between layer configurations rather than running entirely separate systems. It keeps training, data standards, and field familiarity consistent, even when the hazard changes.
Conclusion
Live GIS maps for emergency response aren't a single tool doing a single job worldwide; they're a flexible framework that gets shaped by whichever hazard a region actually faces. A wildfire crew, a flood response team, and an earthquake search-and-rescue unit are all solving the same core problem – knowing what's happening right now together – but the data that makes that possible looks different in each case. Agencies that configure their GIS systems around their actual hazard profile, test them before a crisis, and build in resilience for the exact conditions a disaster creates get the most out of the technology when it matters most.
FAQs
1. What is a live GIS map for emergency response?
It's a real-time geographic information system that tracks hazards, resources, and personnel during a crisis, giving responders a shared, continuously updated view of the situation.
2. Does the same GIS software work for wildfires, floods, and earthquakes?
The underlying platform is often similar, but the data layers differ significantly — wind and fuel data for wildfires, river and rainfall data for floods, and damage and aftershock data for earthquakes.
3. Which regions rely most heavily on wildfire GIS mapping?
Fire-prone regions like the western United States, southern Australia, and parts of the Mediterranean depend heavily on live perimeter and wind-tracking GIS systems.
4. How do flood-prone regions use GIS mapping differently?
They prioritize river and tide gauge data, rainfall accumulation, and road closure tracking over the fast-moving perimeter tracking that wildfire response needs.
5. Why is earthquake GIS mapping different from wildfire or flood mapping?
Earthquakes don't offer advance warning, so earthquake GIS focuses on rapid post-event coordination — damage reports, aftershock tracking, and utility outage mapping — rather than predictive tracking.
6. Can live GIS maps work in regions with unreliable internet during a disaster?
Yes, provided the platform includes offline or low-bandwidth functionality, which matters most in regions where the disaster itself can damage connectivity infrastructure.
7. Do multiple agencies typically share one live GIS map?
In many regions, yes — fire, police, EMS, and utility teams increasingly share one platform, though some regions still run more fragmented, agency-specific systems.
8. How do agencies decide which GIS data layers to prioritise?
By identifying their region's primary hazard profile first, then selecting live data feeds and infrastructure layers relevant to that specific hazard.
9. Is live GIS mapping only useful during an active disaster?
No — many agencies run the same systems during routine operations and planned drills, which keeps field teams familiar with the tool before it's needed in a real emergency.
